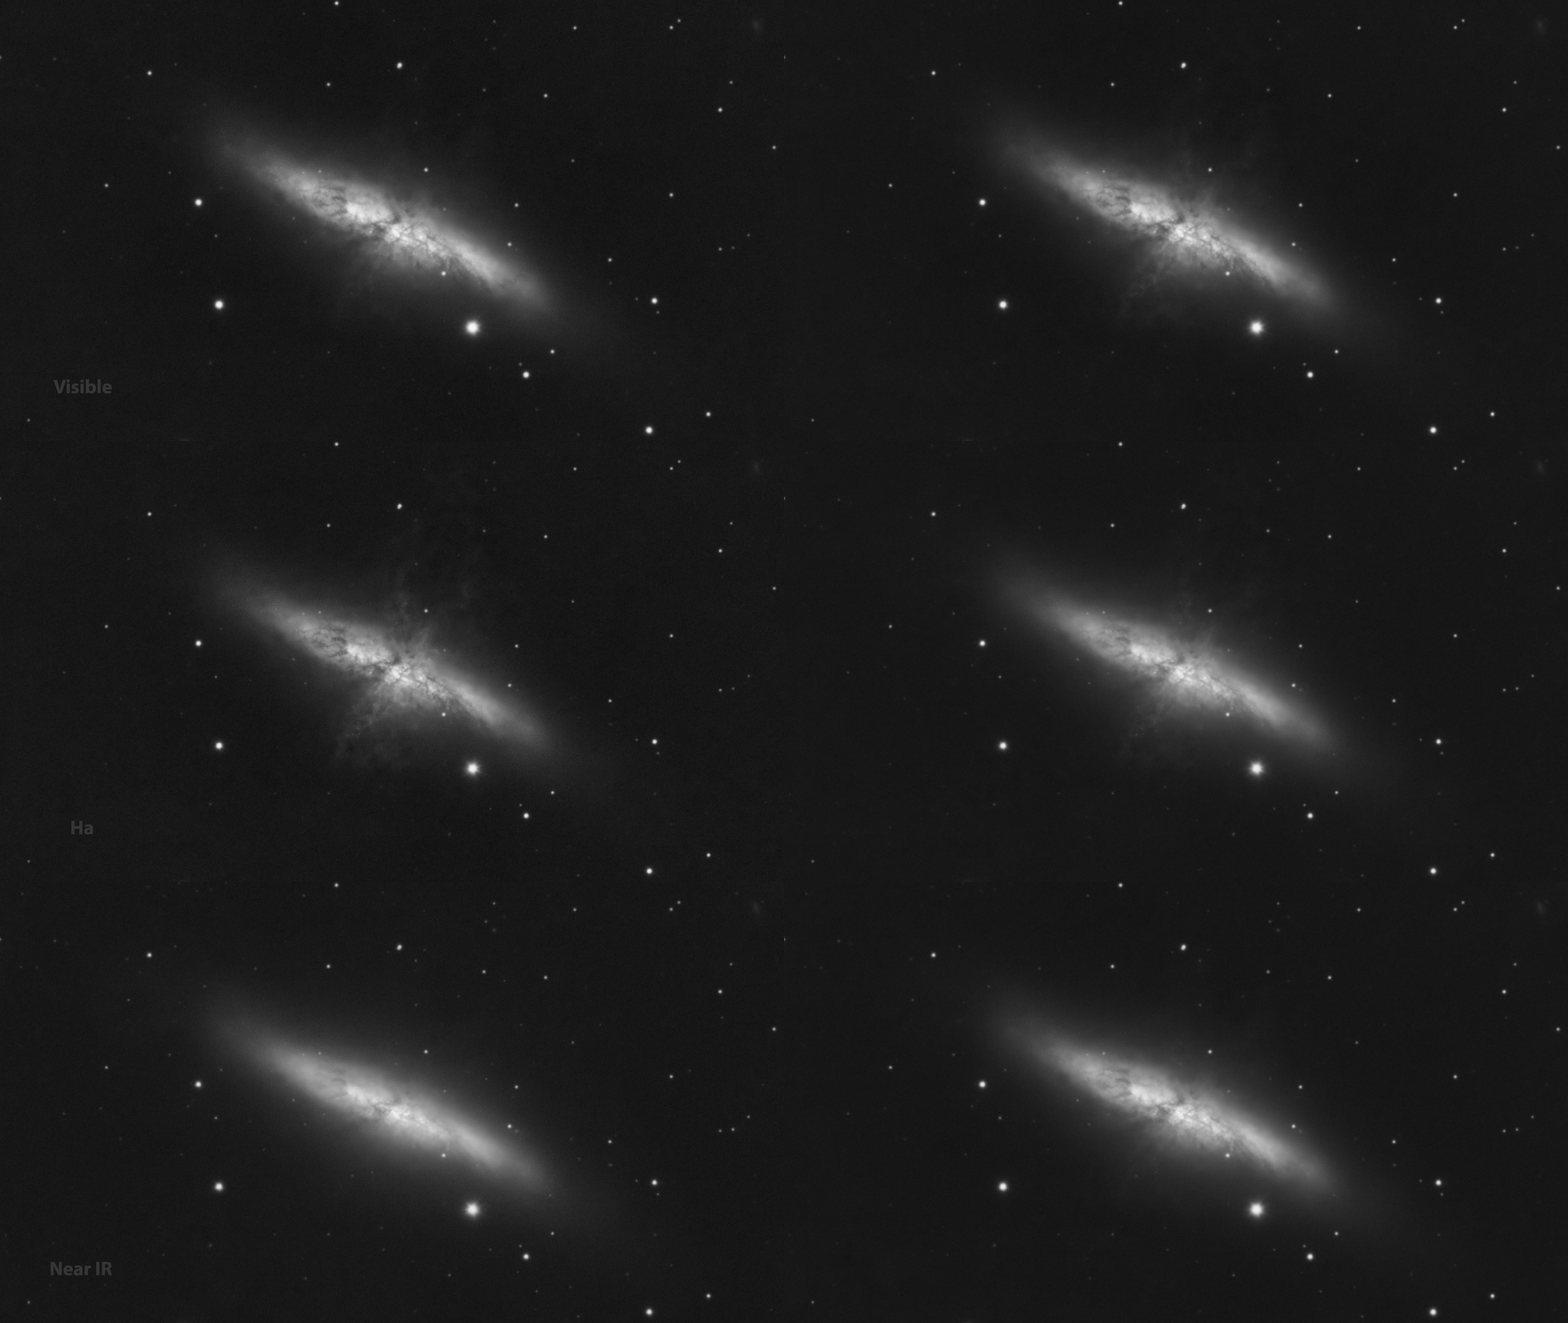
So looking at old data and trying things with that. Like with M82.
I have a lot of M82 data both in visible (no filter), Ha and Near IR (685nm). On viewtopic.php?p=21868 is the version of all that data combined in 1 image, plus all the capture data.
But that is not really showing the difference between those wavelengths, so I made this animated GIF which shows it.
The Near IR was almost colourless, so made it all in greyscale. That's also less distracting with changing colours, so the structures are in focus.
The animation is in 1920x1080px and a slow cycle, so you can focus on certain areas to see the differences. In Near IR for example, there are stars that are (almost) not not visible in visible and Ha and also certain parts of M82.
Menno
Click for bigger version