Page 1 of 1
How do I use the sensor analysis?
Posted: Fri Jun 08, 2018 12:21 am
by Danoglide64
I was reading the manual and saw a link on youtube for sensor analysis, about half way through I decided to do it. The light condition was good so I ran the tool "sensor analysis" and came up with the final results displayed in the lower right corner. My measured bit depth was 12 and all the info in the chart required a purchase of Sharpcap Pro to copy and paste. What does all this mean? Is the results of the test applied somewhere so I can get better results through my ZWOASI224 camera tonight?
Thanks,
Dano
Re: How do I use the sensor analysis?
Posted: Fri Jun 08, 2018 12:24 am
by Danoglide64
P.S.
The video kept freezing up about halfway through so I never found out anything past the Dud showing Horsehead Nebulae.
Re: How do I use the sensor analysis?
Posted: Fri Jun 08, 2018 12:37 am
by Danoglide64
P.P.S.
Here's a screenshot of my test, what does it mean and what can I do
with it?
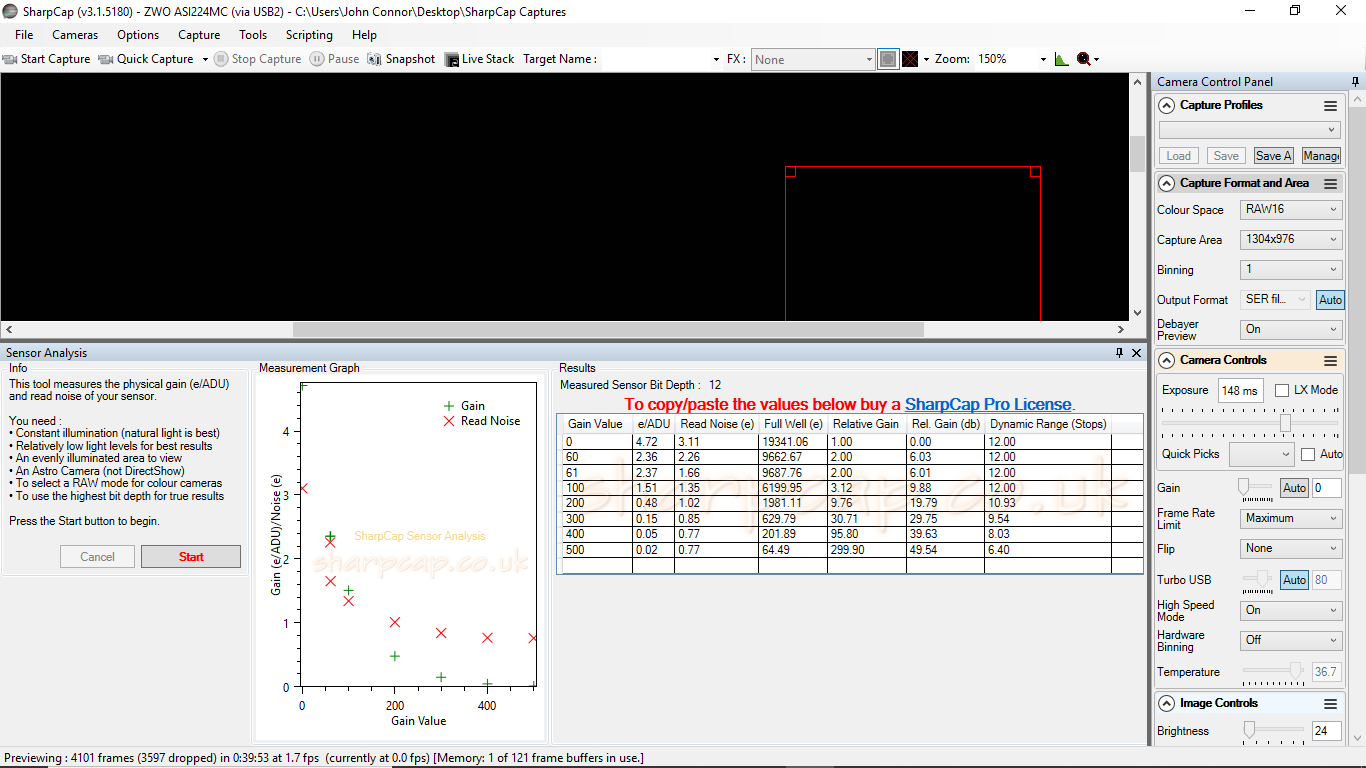
- Screenshot (8).png (167.93 KiB) Viewed 2059 times
Re: How do I use the sensor analysis?
Posted: Fri Jun 08, 2018 6:38 pm
by admin
The figures calculated by sensor analysis describe the characteristics of your camera sensor and how much noise it creates at different gains. With those figures it's possible to properly calculate correct (or at least target minimum) exposures for deep sky imaging. It's a long read, but this article explains it all
viewtopic.php?f=35&t=456. The SharpCap Pro 'Smart Histogram' and 'Smart Histogram Brain' perform these calculations automatically for you.
cheers,
Robin